


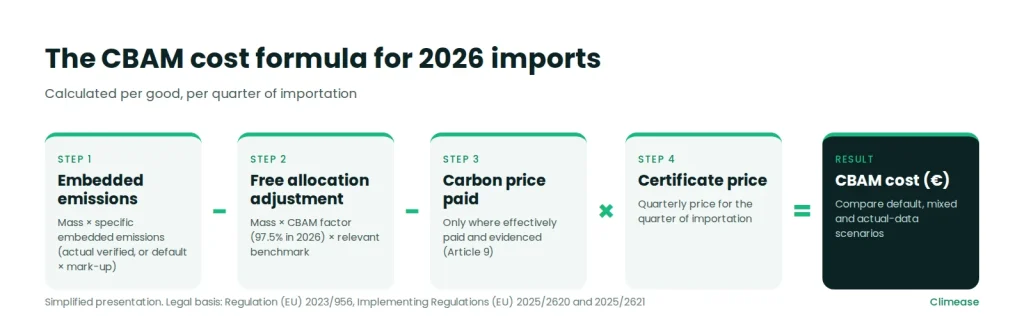
A defensible CBAM cost estimate for 2026 imports uses four inputs: the correct embedded-emissions value for each good, the matching free allocation adjustment, the certificate price for the quarter of importation and only those carbon-price deductions that can be evidenced. The number of certificates equals embedded emissions minus the free allocation adjustment and any eligible carbon price paid; the cost equals that number multiplied by the certificate price. One figure is not enough. Finance teams should compare a default-value scenario with a verified actual-data scenario and document every assumption.
2026 is the first year in which CBAM creates a real cost. Authorised CBAM declarants will buy certificates on the common central platform from 1 February 2027 and must declare 2026 imports and surrender the matching certificates by 30 September 2027. Budgets, accruals and supplier decisions made now depend on how well the calculation is built.
The CBAM cost calculation in brief
- Certificates required = embedded emissions − free allocation adjustment − eligible carbon price paid (expressed in certificates).
- CBAM cost = (embedded emissions -free allocation adjustment – eligible carbon price paid) x CBAM certificate price for the quarter of importation.
- Default values carry a mark-up in 2026: 10% for cement, iron and steel, aluminium and hydrogen, and 1% for fertilisers.
- The free allocation adjustment uses the CBAM factor, which is 97.5% in 2026, and the relevant benchmark under Implementing Regulation (EU) 2025/2620.
- The 2026 certificate prices are quarterly: €75.36 for Q1 and €75.28 for Q2. The Q3 price is due on 5 October 2026.
- Model carbon price paid abroad at zero until it is effectively paid and evidenced.
The CBAM cost formula
The CBAM Regulation charges importers for the emissions embedded in goods, reduced by the free allocation that EU producers of the same goods still receive under the EU ETS, and by any carbon price already paid in a third country. For each good and each quarter, the calculation can be written as follows.
| Term | Definition |
|---|---|
| EE | Embedded emissions = mass imported (t) × specific embedded emissions (tCO2e/t) |
| FAA | Free allocation adjustment = mass imported (t) × specific embedded free allocation (SEFA), where SEFA combines the CBAM factor and the relevant EU ETS benchmark (Implementing Regulation (EU) 2025/2620) |
| CPP | Carbon price effectively paid in a third country, converted into an equivalent number of certificates (Article 9 of Regulation (EU) 2023/956) |
| N | Certificates to surrender = EE − FAA − CPP |
| P | CBAM certificate price for the quarter of importation (2026) in €/tCO2e |
| Cost | (EE − FAA − CPP) × P, which is the same as N × P |
The inputs you need
| Input | Where it comes from | What to check |
|---|---|---|
| Mass by CN code | Customs declarations for goods released for free circulation | CN code at eight digits, net mass, quarter of release |
| Specific embedded emissions | Supplier verified actual data, or Commission default values | Installation, reporting period, verification report; for defaults, the corrected 2026 tables |
| Default mark-up | Implementing Regulation (EU) 2025/2621 as corrected by (EU) 2026/1740 | 10% in 2026 for most sectors, 1% for fertilisers; calculate it from the base total |
| Scope of emissions | Annex II of Regulation (EU) 2023/956 | For iron and steel, aluminium and hydrogen only direct emissions count; cement and fertilisers also include indirect |
| CBAM factor and benchmark | Directive 2003/87/EC Article 10a and Implementing Regulation (EU) 2025/2620 | Benchmark matching the product, the production route and the data type (default or actual) |
| Carbon price paid | Evidence from the country where it was paid | Amount effectively paid, rebates or compensation received, independent verification |
| Certificate price | Commission CBAM certificate price page | Quarter-specific price, not a live EU ETS spot price |
Choosing the emissions value
The emissions value is the input that moves the result most. Regulation (EU) 2023/956 allows two routes. Actual embedded emissions are calculated by the operator of the producing installation under the methods of Implementing Regulation (EU) 2025/2547 and must be verified by an accredited CBAM verifier before a declarant can use them. Default values are published by the Commission per country and CN code, and apply when verified actual data is not available.
Default values are deliberately conservative, and from 2026 they carry a mark-up. The corrected annexes of Implementing Regulation (EU) 2025/2621, replaced by Implementing Regulation (EU) 2026/1740 with effect from 1 January 2026, tell the model to take the base total-emissions value and apply the mark-up separately. Where a listed country has a blank or dash for a CN code, the value for “other countries and territories” applies, not zero. For what changed in the corrected tables and how to rebuild your model, see our guide CBAM Default Values 2026: What the August Corrections Change for Cost Models.
Complex goods add a layer. A rolled steel product contains the emissions of the crude steel used to make it. If the rolling mill has verified data for its own process but not for the purchased slabs, the precursor falls back to default values. That is the mixed-data case in the example below, and it is common in 2026.
How the free allocation adjustment works
EU producers of CBAM goods still receive part of their EU ETS allowances for free. To avoid charging importers more than EU competitors, the number of CBAM certificates is reduced by a free allocation adjustment. Implementing Regulation (EU) 2025/2620 defines it per good as the specific embedded free allocation multiplied by the mass imported. The specific embedded free allocation combines the relevant EU ETS benchmark for the good with the CBAM factor, which reflects how much free allocation is still granted in that year.
The CBAM factor falls as free allocation is phased out: 97.5% in 2026, 95% in 2027, 90% in 2028, 77.5% in 2029, 51.5% in 2030, 39% in 2031, 26.5% in 2032 and 14% in 2033, reaching zero in 2034. The same imports therefore become more expensive each year even if emissions and prices do not change. Regulation (EU) 2025/2620 also distinguishes between goods declared with default values and goods declared with actual data, and between production routes, so the benchmark must match both.
Carbon price paid abroad
Article 9 of Regulation (EU) 2023/956 allows a reduction for a carbon price effectively paid on the embedded emissions in a third country, after any rebate or compensation. The reduction is available where the embedded emissions are determined on the basis of actual emissions, and the declarant must hold documentation, certified by an independent person, showing that the price was effectively paid. Regulation (EU) 2025/2083 extended this to carbon prices paid in any third country, not only the country of origin, and from 2027 the Commission may publish yarly default carbon prices as an alternative. On 23 September 2026 the Commission’s legislation page did not yet list an adopted implementing act on carbon price paid for the definitive period. A prudent model sets this deduction to zero until the amount paid is documented and independently certified.
Worked example: hot-rolled steel imported in Q2 2026
The example below shows the mechanics. The emissions values and the benchmark are illustrative round numbers, not official values for any country or installation. Replace them with the corrected Annex I default values, the Annex values of Regulation (EU) 2025/2620 and your suppliers’ verified data before using the model.
| Assumption | Value used |
|---|---|
| Good | Hot-rolled flat steel, CN 7208 (iron and steel: direct emissions only) |
| Quantity imported | 1,000 tonnes, released in Q2 2026 |
| Default base value (illustrative) | 2.60 tCO2e/t |
| Default mark-up 2026 | 10%, giving 2.86 tCO2e/t |
| Verified actual value (illustrative) | 1.95 tCO2e/t |
| Mixed data (illustrative) | 2.40 tCO2e/t: own rolling emissions verified, crude-steel precursor on default |
| Benchmark (illustrative) | 1.53 tCO2e/t |
| CBAM factor 2026 | 97.5% |
| Carbon price paid abroad | None evidenced |
| Certificate price | €75.28 (Q2 2026, published by the Commission) |
The free allocation adjustment is 1,000 t × 97.5% × 1.53 = 1,491.75 tCO2e. It is held constant across the three scenarios to isolate the effect of the emissions data. In practice, the adjustment for actual and mixed data follows Articles 2 and 4 of Regulation (EU) 2025/2620 and can differ from the default case.
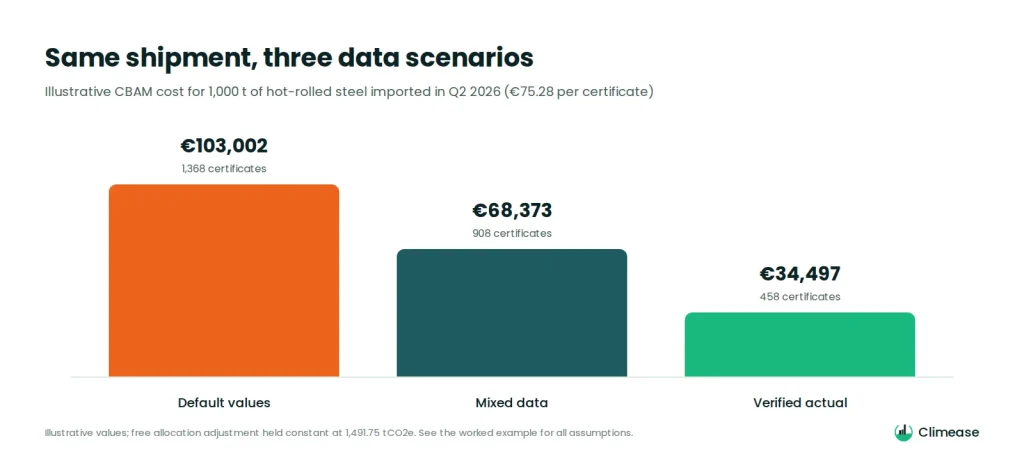
Step by step for the default case: 1,000 t × 2.86 tCO2e/t gives 2,860 tCO2e of embedded emissions. Deducting the adjustment of 1,491.75 tCO2e leaves 1,368.25 certificates. No carbon price paid abroad is evidenced, so nothing further is deducted. At the Q2 2026 price of €75.28, the cost is €103,002, or about €103 per tonne of steel. If the same supplier shipped another 1,000 t in Q1, that shipment would be priced at €75.36 instead, and the two quarters would be added together in the annual declaration.
Three scenarios compared
| Line | Default values | Mixed data | Verified actual |
|---|---|---|---|
| Specific embedded emissions (tCO2e/t) | 2.86 | 2.40 | 1.95 |
| Embedded emissions (tCO2e) | 2,860.00 | 2,400.00 | 1,950.00 |
| Free allocation adjustment (tCO2e) | 1,491.75 | 1,491.75 | 1,491.75 |
| Certificates required | 1,368.25 | 908.25 | 458.25 |
| CBAM cost at €75.28 | €103,002 | €68,373 | €34,497 |
| Cost per tonne of steel | €103.00 | €68.37 | €34.50 |
Two lessons stand out. First, the free allocation adjustment matters: ignoring it would put the default case at €215,301, more than double the correct figure. Second, the data type drives most of the variance. Moving from defaults to verified actual data cuts the illustrative cost by about two thirds, and the mixed case shows that verifying only part of the supply chain still leaves significant default exposure on the precursor.
Sensitivity: what moves the number
A single estimate hides risk. Run the model against the inputs most likely to change before the September 2027 surrender deadline.
| Change from the base case | Default values | Verified actual |
|---|---|---|
| Base case (Q2 2026 price €75.28) | €103,002 | €34,497 |
| Certificate price €70.00 | €95,778 | €32,078 |
| Certificate price €85.00 | €116,301 | €38,951 |
| Benchmark 10% lower | €114,232 | €45,727 |
| Actual emissions 10% higher | – | €49,177 |
| Same import in 2027 (CBAM factor 95%, default mark-up 20%, same price) | €125,454 | €37,377 |
| No free allocation adjustment (common error) | €215,301 | €146,796 |
All figures use the illustrative assumptions above and are rounded to the nearest euro.
The sensitivity table shows why the data type matters more than the price. A €10 move in the certificate price changes the default case by about €14,000 in this example, while moving from defaults to verified data changes it by almost €70,000. The benchmark is the input most often overlooked: a 10% lower benchmark raises the verified-data cost by a third, because the adjustment is large relative to the net obligation. The 2027 row also shows the effect of the phase-out of free allocation and the higher default mark-up on the same shipment.
From estimate to budget
A calculation becomes useful to finance when it is repeated and reconciled. Run the model at least quarterly, by supplier and CN code, using the published price for each closed quarter and an explicit estimate for open quarters. Report at least two figures: a full-default baseline, which is the cost if no supplier data is accepted, and a best-supported estimate using the verified data you already hold. The gap between the two shows how much value verification work is worth and where procurement should focus supplier conversations first.
Common errors in CBAM cost models
- Using a live EU ETS price instead of the Commission’s quarterly price for the quarter of importation.
- Leaving out the free allocation adjustment, or applying a benchmark that does not match the production route or data type.
- Copying default values from the original 2025 tables instead of the corrected annexes applicable from 1 January 2026.
- Treating a dash or blank in a default-value row as zero instead of using the “other countries and territories” value.
- Applying the default mark-up twice, or importing old pre-calculated mark-up columns.
- Adding indirect emissions for iron and steel or aluminium goods, where only direct emissions count.
- Deducting a foreign carbon price because a country has a carbon tax, without proof that it was effectively paid on those emissions.
- Using supplier figures that are not verified, or that cover a different installation or period.
Build an audit trail
The declaration will be checked, and finance will need to explain every change in the provision. For each calculation run, keep:
- The customs extract used, with the date it was pulled.
- The version of the default-value dataset and the regulation it comes from.
- Supplier emissions reports and verification reports, linked to installation and period.
- The benchmark, production route and CBAM factor applied to each line.
- The certificate price and its publication date for each quarter.
- Evidence for any carbon price deduction, or a note that none was applied.
- A variance bridge that separates changes in volume, emissions data, benchmark and price.
Our Climease CBAM software can do all this for you Climease connects customs data, supplier emissions and the latest regulatory values, so finance teams can see default, mixed and verified scenarios side by side and trace every figure to its source, while keeping the mandatory audit trail.
Häufig gestellte Fragen
What is the formula for CBAM certificates?
Certificates to surrender equal embedded emissions minus the free allocation adjustment and any evidenced carbon price paid abroad. The cost equals that number multiplied by the CBAM certificate price.
Which certificate price applies to 2026 imports?
The quarterly price the Commission publishes for the quarter in which the goods were imported. Q1 2026 was €75.36 and Q2 2026 €75.28; Q3 is due on 5 October 2026 and Q4 on 4 January 2027.
What is the CBAM factor in 2026?
97.5%. It reflects the share of EU ETS free allocation still granted to EU producers and falls in later years, which increases the net CBAM obligation.
How much is the default value mark-up in 2026?
10% for cement, iron and steel, aluminium and hydrogen, and 1% for fertilisers, applied to the base total default value.
Can I deduct a carbon price paid in the supplier’s country?
Only a carbon price effectively paid and evidenced, net of any rebate or compensation, and only where the embedded emissions are based on actual emissions. Model it at zero until the evidence exists.
Do indirect emissions count for steel?
No. For iron and steel, aluminium and hydrogen, only direct embedded emissions count towards the certificate obligation.
When are certificates paid for?
Certificates for 2026 imports are bought on the common central platform from 1 February 2027 and surrendered by 30 September 2027.
Book a CBAM cost-model review or run a 2026 CBAM cost estimate.
This article provides general information and does not constitute legal, customs, tax or accounting advice. The worked example uses illustrative values and shows the Berechnung mechanics only.
Official sources
- CBAM legislation and guidance — Regulations (EU) 2023/956, 2025/2083, 2025/2620, 2025/2621 and 2026/1740
- Price of CBAM certificates — quarterly 2026 prices and publication dates
- Commission Implementing Regulation (EU) 2025/2620 — free allocation adjustment
- Regulation (EU) 2025/2083 — sales from 1 February 2027, declaration and surrender by 30 September
Abonnieren Sie unseren Newsletter