


Most CBAM cost models we review get the emissions side roughly right and the benchmark side wrong. The importer calculates embedded emissions carefully, then subtracts a single benchmark number copied from a spreadsheet. That shortcut can overstate or understate the certificate bill by tens of euros per tonne, and it will not survive a review by the national competent authority.
The reason is simple. The benchmark you deduct is not chosen independently. It follows from the type of emissions data you are using.
Answer capsule
The CBAM free allocation adjustment is not a universal table lookup. The correct calculation depends on whether embedded emissions use defaults, actual verified data or a mixture across inputs. Pair each emissions data type with the corresponding benchmark logic and document the production-route assumptions.
This guide explains how CBAM benchmarks work in 2026, using the terms in Commission Implementing Regulation (EU) 2025/2620 and the Commission’s Guidance No. 4 (August 2026). It covers default-data treatment, actual-data calculation, mixed inputs, a worked example and a decision table you can use with your team.
Terminology box: official terms first
| Official term | Symbol | What it means in practice |
|---|---|---|
| Free allocation adjustment | FAA | The tonnes of CO2e deducted from embedded emissions to mirror the free allowances EU producers still receive under the EU ETS. |
| Specific embedded free allocation | SEFA | The free allocation embedded in one tonne of the good, in tCO2e per tonne. FAA = SEFA × imported mass. |
| Default CBAM benchmark | BM (Column B) | One value per CN code, set out in Column B of the Annex to Regulation 2025/2620. Already includes the precursors. Used with default emission values. |
| Process-related CBAM benchmark | BM* (Column A) | A value per production process and, where relevant, per production route. Used when the installation reports verified actual data. |
| CBAM factor | CBAMy | The share of free allocation still granted in year y: 97.5% in 2026, falling to 0% in 2034. |
| Cross-sectoral correction factor | CSCF | An EU ETS correction factor. The guidance sets it at 1.0 for 2026 to 2034 on a preliminary basis. |
| Production route | e.g. BF/BOF, DRI/EAF, scrap/EAF | The technology used to make the good. It decides which benchmark row applies when the CN code alone is not enough. |
Plain-English terms you will hear. “Calculated benchmark” usually means the SEFA built up from BM* values and precursor masses. “Hybrid” or “mixed” means a good whose own process uses actual data while some precursors fall back to defaults. Neither word appears in the regulation, so use the official terms in anything you file or send to a verifier.
Where the benchmark sits in the certificate calculation
The number of CBAM certificates you surrender for a year is embedded emissions minus two deductions: the free allocation adjustment and any carbon price effectively paid in the country of origin. We cover the full formula in our CBAM cost calculation guide. Here we focus on the middle term.
Certificates = EE − FAA − CPP
The free allocation adjustment itself is calculated per good:
FAAg = SEFAg,y × Mg
For a simple good, or for any good declared with default values, SEFA is the benchmark multiplied by the CBAM factor and the correction factor:
SEFAg,y = CBAMy × CSCFy × BMg
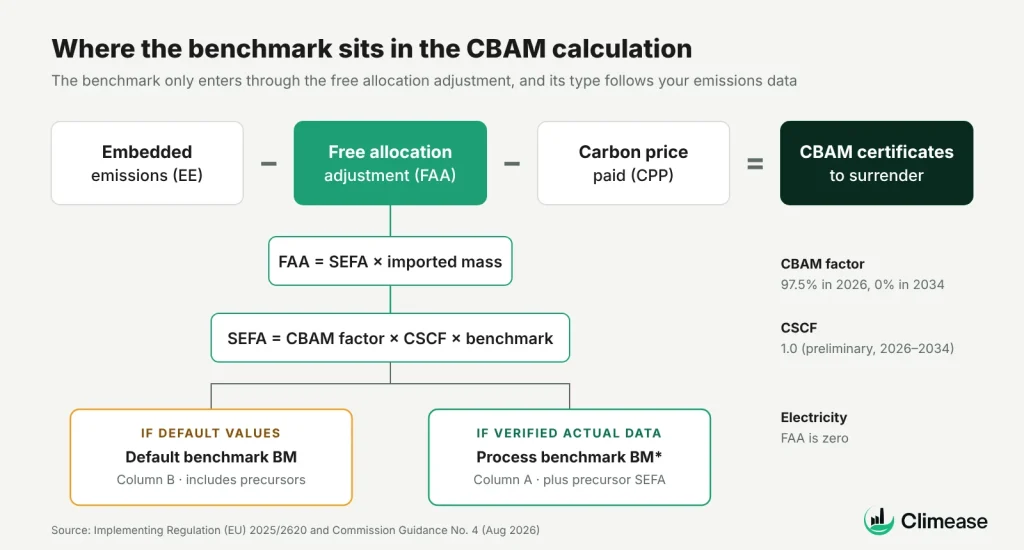
Three points follow from this structure.
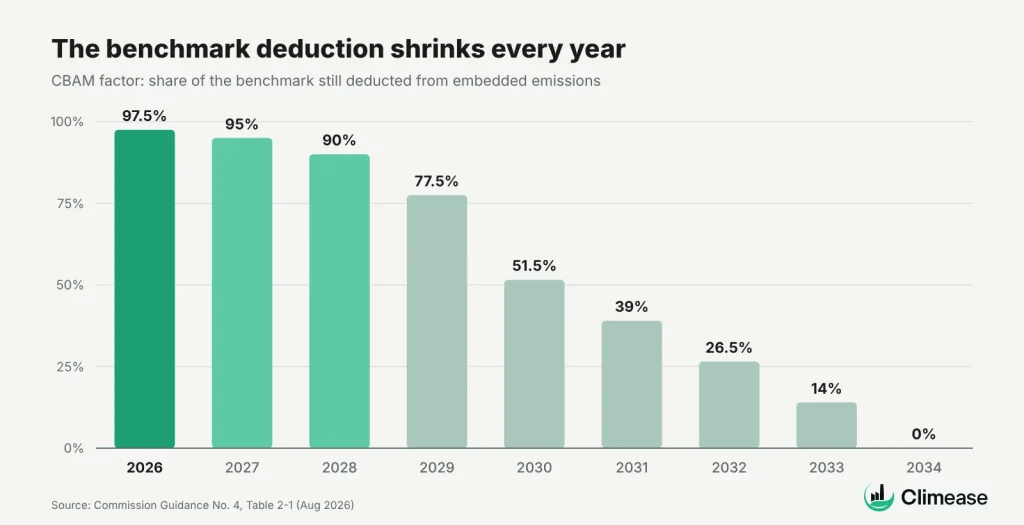
- The benchmark only reduces the bill. A higher applicable benchmark means a larger deduction and fewer certificates.
- Its weight shrinks every year. At 97.5% in 2026 the deduction is close to the full benchmark. By 2030 it falls to 51.5%, and in 2034 it disappears. Getting the benchmark right matters most now, while it is still large.
- It is not the same for everyone. The value depends on the CN code, the data type you use and, for some goods, the production route.
One exception to keep in mind: electricity (CN 2716 00 00) has a free allocation adjustment of zero, because EU electricity producers receive no free allocation.
Scenario 1: default values, default benchmark
If you declare a good using the Commission’s default values for embedded emissions, you must also use the default CBAM benchmark from Column B. The guidance is explicit: when the declarant uses default values for specific embedded emissions, SEFA must also be determined from default values. You cannot pair a default emissions figure with a more favourable process benchmark.
The default benchmark has three features that matter for your model.
- It already includes the precursors. For a complex good such as a hot-rolled steel product, Column B gives one figure that covers the rolling step and the crude steel, pig iron and sinter behind it. You do not build it up yourself.
- It is tied to an assumed production route. Where the benchmark depends on the route, the route is the one assumed in the default values. You find it in Annex I of the Default Values Act (Regulation 2025/2621) for the country of origin, or in the “other countries and territories” table when the origin is unknown.
- It applies the same way regardless of your supplier. A low-emission supplier gains nothing from the default benchmark, because the default route assumption overrides what the plant actually does.
The lookup is therefore a two-step process. First find the production route that the default values assume for your CN code and origin. Then read the matching default benchmark in Column B. The guidance gives the example of screws and bolts (CN 7318 15) from Algeria, where the default values assume carbon steel made via BF/BOF, and that route indicator points you to the correct Column B value.
Default values for 2026 also carry a mark-up on emissions (10% for most goods, 1% for fertilisers). The benchmark carries no mark-up. That asymmetry is why default declarations are expensive: the emissions side is inflated while the deduction stays at a standard level. We explain the mark-up in more detail in our guide on avoiding default values.
Scenario 2: verified actual data, process-related benchmarks
When the installation monitors its emissions under the CBAM methodology and has them verified, the SEFA is calculated, not looked up. This is what people usually mean by a “calculated benchmark”. The operator applies the process-related benchmark BM* from Column A to its own production process, then adds the free allocation embedded in each precursor:
SEFAg,y = CBAMy × CSCFy × BM*g + Σ (mi,y × SEFAi,y′)
Here m is the mass of precursor i consumed per tonne of good, and SEFA of the precursor uses the year in which that precursor was produced.
What changes compared with defaults:
- The route is the real one. BM* differs by production route where the EU ETS benchmarks do, for example BF/BOF versus EAF for crude steel (CN 7207 11 11 is the guidance’s example). The route must match what the installation does.
- BM* values are the same for every country. Unlike default emission values, process-related benchmarks do not vary by origin.
- Precursor masses become audit data. An integrated steel plant using the “bubble approach” must track the CN code of each intermediate product and the mass of sinter per tonne of pig iron, pig iron per tonne of crude steel, and crude steel per tonne of final product.
- The SEFA arrives with the emissions report. As an importer you do not calculate it. You receive it in the operator’s verified emissions report and multiply it by the imported mass.
The practical consequence for importers: you need the SEFA line in the supplier’s report, not only the specific embedded emissions. If a supplier sends verified emissions without SEFA, the dataset is incomplete for your declaration. Our guide on supplier emission calculations explains what a complete supplier dataset should contain.
Scenario 3: mixed inputs, where most real supply chains sit
Many producers make their final good with actual, verified data for their own process but buy some precursors from suppliers who cannot provide verified reports. The guidance handles this precursor by precursor:
- If all precursors are made in the operator’s own installation, or verified reports exist for every externally sourced precursor, actual SEFA values are used for all of them.
- If an externally sourced precursor has no verification report, its SEFA is determined from defaults, using the default benchmark in Column B for that precursor.
So a mixed calculation is not a compromise number. It is the actual-data formula, where each precursor term carries whichever SEFA its own evidence supports. The operator’s own process always uses BM* from Column A.
Production composition matters as much as data type. Two examples from the guidance show why.
- Mixed cement. A plant grinds cement from its own white clinker and purchased grey clinker. The grinding step uses the process benchmark. The white clinker contributes its actual SEFA. The purchased grey clinker, with no verification report, contributes the default benchmark. The result is a mass-weighted sum.
- High-alloy steel via EAF. Scrap carries zero embedded emissions and zero SEFA. Ferro-chromium, DRI and pig iron each carry either a verified SEFA or a default one. If a DRI producer wants credit for skipping agglomerated ore, it can only get it with verified actual data, because the default DRI benchmark assumes sintered ore was used.
Two zero-rules also shape the mix. Precursors made in the EU, or in exempted countries such as Norway or Switzerland, carry a SEFA of zero. For ammonia, hydrogen production already sits inside the ammonia benchmark, so no separate free allocation is added for hydrogen, even if it was made in a separate process.
Worked example: 1,000 tonnes of hot-rolled steel imported in 2026
An importer brings in 1,000 tonnes of hot-rolled flat steel in 2026. We compare three supply situations. All emission and benchmark values below are illustrative, chosen to show the mechanics. They are not taken from the Annex of Regulation 2025/2620; check the Column A and Column B values for your exact CN code before modelling. We assume a certificate price of €75, no carbon price paid at origin, CBAM factor 97.5% and CSCF 1.0.
Case A: default values. The supplier has no verified data. Default embedded emissions, including the 2026 mark-up, are 2.60 tCO2e/t. The default benchmark from Column B is 1.53 tCO2e/t.
- SEFA = 0.975 × 1.53 = 1.492 tCO2e/t
- Net = 2.60 − 1.492 = 1.108 tCO2e/t
- Certificates = 1,108, about €83,100
Case B: verified actual data, integrated BF/BOF plant. The supplier’s verified report shows 2.05 tCO2e/t and a SEFA of 1.43 tCO2e/t, built from the BM* values for sinter, hot metal, crude steel and rolling plus the plant’s tracked intermediate masses.
- Net = 2.05 − 1.43 = 0.62 tCO2e/t
- Certificates = 620, about €46,500
Case C: mixed data, re-rolling mill. The supplier rolls purchased slabs and has verified data for its own rolling step: 0.12 tCO2e/t of product, with an illustrative rolling BM* of 0.06. It uses 1.04 t of slab per tonne of product. 60% of the slab comes from a verified supplier (1.95 tCO2e/t, SEFA 1.40). 40% comes from an unverified supplier, so that share takes default emissions (2.45 tCO2e/t) and the default slab benchmark (1.45, giving SEFA 1.414).
- EE = 0.12 + 1.04 × (0.6 × 1.95 + 0.4 × 2.45) = 2.356 tCO2e/t
- SEFA = 0.975 × 0.06 + 1.04 × (0.6 × 1.40 + 0.4 × 1.414) = 1.520 tCO2e/t
- Net = 0.836 tCO2e/t, so 836 certificates, about €62,700
| Case | Embedded emissions (tCO2e/t) | SEFA (tCO2e/t) | Certificates (1,000 t) | Cost at €75 |
|---|---|---|---|---|
| A. Default | 2.600 | 1.492 | 1,108 | €83,119 |
| B. Verified actual | 2.050 | 1.430 | 620 | €46,500 |
| C. Mixed | 2.356 | 1.520 | 836 | €62,683 |
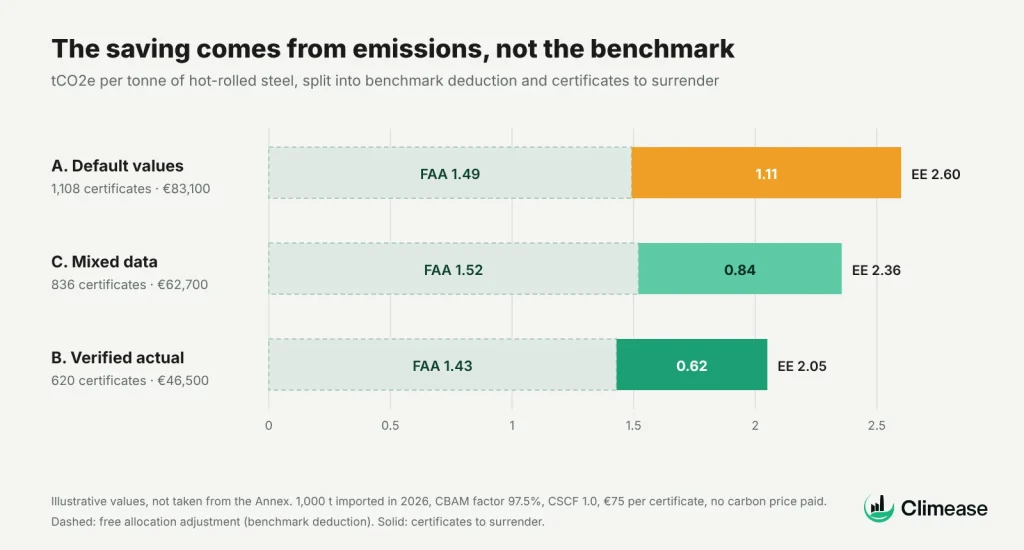
What the example shows. The deduction barely moves between cases: 1.43 to 1.52 tCO2e/t. In Case C it is even higher than with defaults, because the yield factor of 1.04 carries more precursor allocation into each tonne. The savings come almost entirely from the emissions side. The benchmark logic still matters, though. Using the default benchmark in Case B, or a single blended guess in Case C, would misstate the bill and break the link between the declaration and the verified report.
Which benchmark applies? A selection decision tree
Work through the questions in order for each good, and then for each precursor inside it. The answer to the first question decides most of the rest.
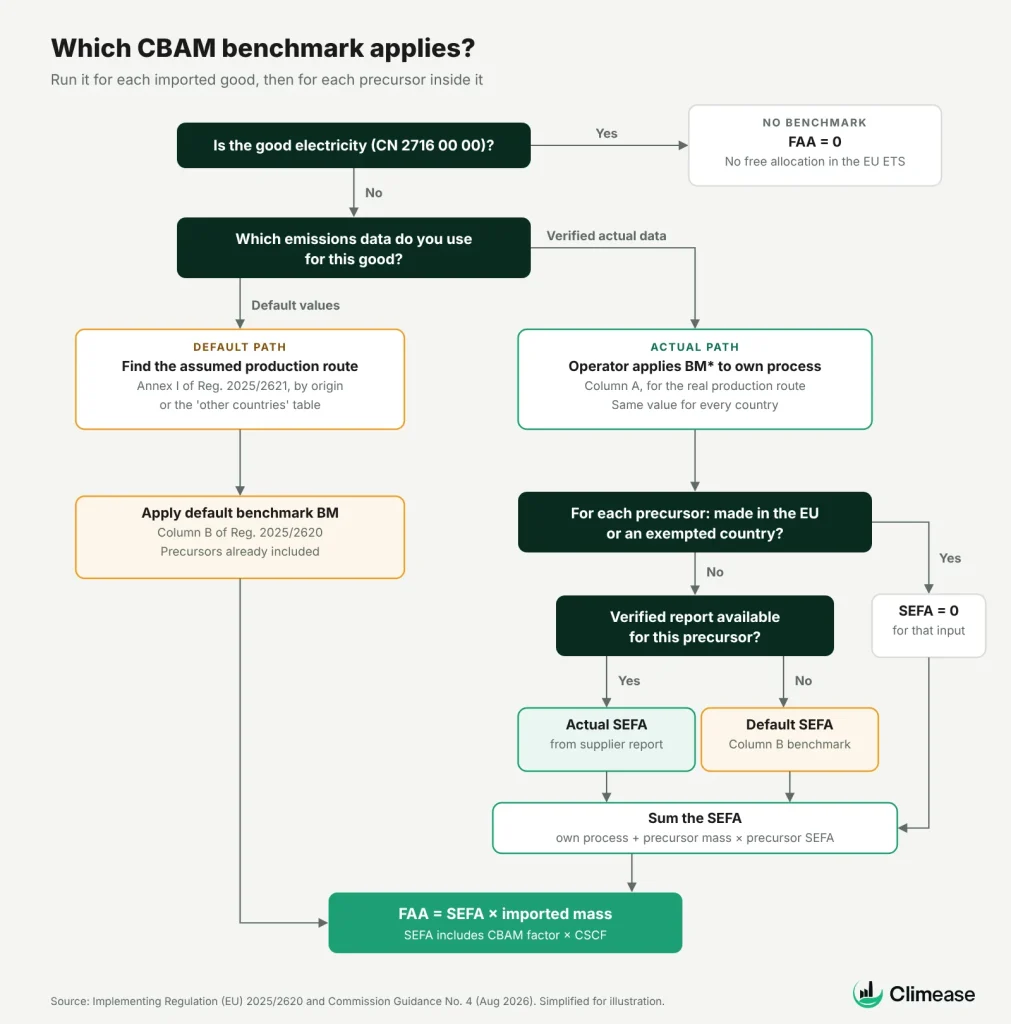
| Your data situation | Emissions value used | Benchmark used | Who calculates SEFA | Evidence to keep |
|---|---|---|---|---|
| Electricity (CN 2716 00 00) | Actual or default | None: FAA is zero | Nobody | CN code classification |
| Default values for the good | Default value with mark-up | Default BM, Column B, for the route assumed in the default values | Declarant | CN code, origin, route assumed in Annex I of 2025/2621 |
| Verified actual data, all precursors own-made or verified | Actual SEE | BM* from Column A for each process, plus actual precursor SEFA | Operator, in the verified report | Verified emissions report with SEFA, route, intermediate masses |
| Verified actual data, some precursors unverified | Actual SEE for own process, defaults for unverified precursors | BM* for own process, Column B for unverified precursors | Operator, in the verified report | As above, plus precursor CN codes, origins and masses |
| Precursor from the EU or an exempted country | Per CBAM methodology | SEFA of zero for that precursor | Operator | Proof of origin |
| Origin of good or precursor unknown | Default value for “other countries” | Column B, route from the “other countries” table | Declarant | Note explaining why origin is unknown |
Five mistakes we see in benchmark calculations
- Pairing actual emissions with a default benchmark, or the reverse. The data type of the emissions decides the benchmark type. Mixing them for the same input is not allowed, and it is one of the first things a reviewer checks.
- Using one benchmark for every steel or aluminium line. Benchmarks are set at CN code level and, for several goods, by production route. A single “steel benchmark” across a portfolio will be wrong for most lines.
- Ignoring the route behind the default. When you use defaults, the route is the one assumed in Annex I of the Default Values Act for that origin. Assuming EAF because your supplier says so, without verified data, is not supported.
- Missing SEFA in supplier reports. A verified emissions report without the embedded free allocation leaves you unable to declare on actual data. Ask for SEFA, the route and the precursor breakdown in the same request as the emissions.
- Forgetting the CBAM factor is annual. The factor drops from 97.5% in 2026 to 95% in 2027 and 90% in 2028. A multi-year cost model or a sales price that holds 2026 deductions constant will understate future certificate costs.
The bottom line
The benchmark is not a number you pick. It is a consequence of the data you hold. Default emissions come with the default benchmark and the route the Commission assumed. Verified data comes with process-related benchmarks and the route the plant actually runs. Mixed supply chains combine the two, precursor by precursor, and need the masses and origins to prove it.
If you document those pairings now, your 2026 declaration will reconcile with your suppliers’ verified reports, and your cost model will stay accurate as the CBAM factor falls each year.
Want to see your own numbers? ClimEase calculates the free allocation adjustment per CN code and data type, and shows the default versus actual cost side by side for every supplier. Book a 30-minute call and bring one import line; we will run it with you.
Related reading: CBAM cost calculation 2026: formula and worked example · Avoid EU default values and save on CBAM costs · CBAM emission calculation explained for suppliers
Sources: European Commission: CBAM legislation and guidance · Guidance No. 4: CBAM calculation of the free allocation adjustment (August 2026)
Subscribe to our Newsletter